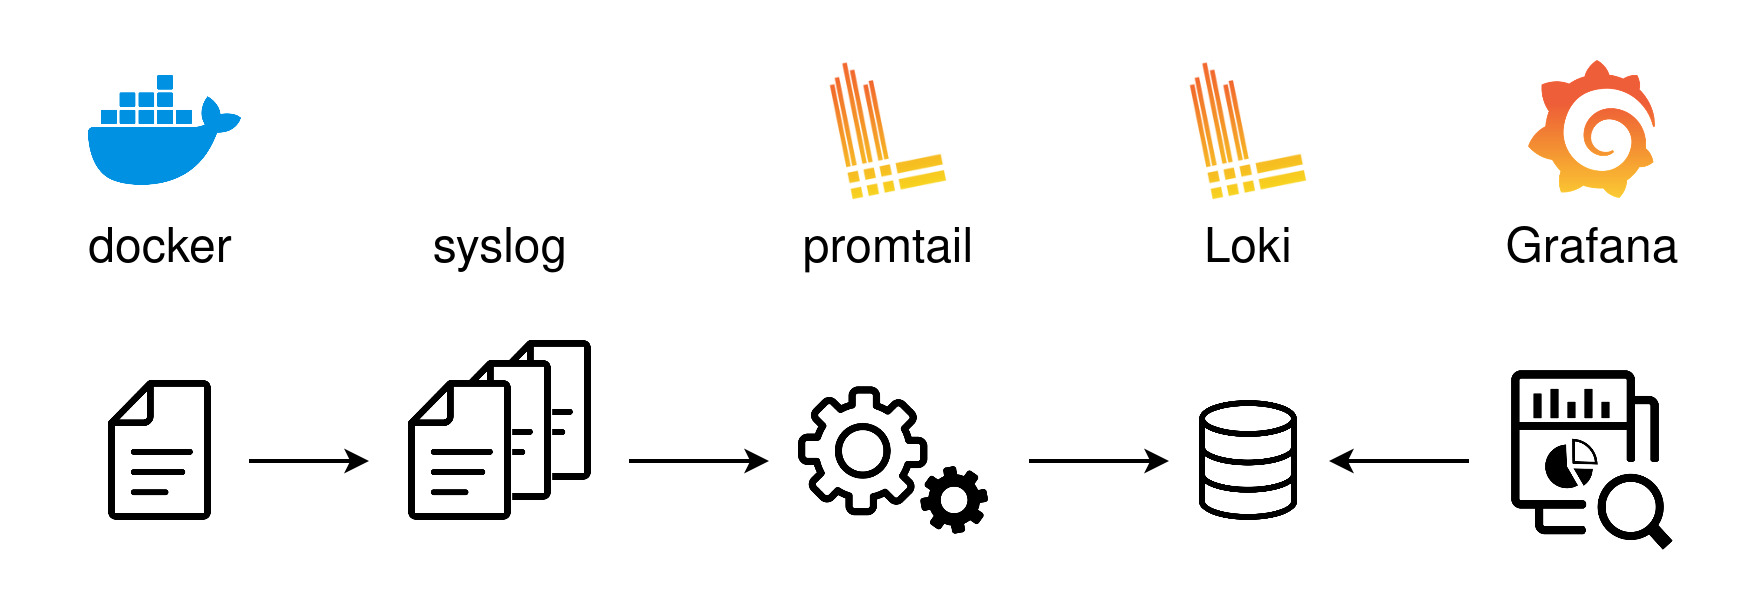
Grafana:
Grafana is an open-source visualization and monitoring tool that allows you to create interactive dashboards and graphs for various data sources.
Key Features:
Supports a wide range of data sources, including Prometheus, Elasticsearch, InfluxDB, and more.
Provides a rich set of visualization options like graphs, tables, heatmaps, and alerting.
Offers templating and dashboard variables for dynamic and flexible dashboards.
Allows for easy sharing and collaboration of dashboards with team members.
Useful Commands/Actions:
Start Grafana service:
systemctl start grafana-serverAccess Grafana web interface:
http://<Grafana_IP>:<Port>Install Grafana plugins:
grafana-cli plugins install <plugin_name>Reload Grafana configuration:
systemctl reload grafana-server
Loki:
Loki is a horizontally scalable, highly available log aggregation system designed to work seamlessly with Grafana.
Key Features:
Stores logs as chunks in object storage (e.g., Amazon S3, Google Cloud Storage).
Utilizes labels and indexing to efficiently query and filter logs.
Supports log streams and log labels for better log organization.
Provides efficient storage and retrieval of logs.
Useful Commands/Actions:
Start Loki service:
loki -config.file=loki-config.ymlAccess Loki web interface:
http://<Loki_IP>:<Port>Query logs from Loki CLI:
loki -config.file=loki-config.yml query <query_expression>
Promtail:
Promtail is an agent that collects and sends logs to Loki for storage and querying.
Key Features:
Collects logs from various sources, such as local files, systemd journals, and Kubernetes pods.
Adds labels and metadata to logs for better categorization and querying.
Provides log enrichment capabilities through log relabeling.
Supports efficient log shipping to Loki via HTTP or gRPC.
Useful Commands/Actions:
Start Promtail service:
promtail -config.file=promtail-config.ymlCheck Promtail logs:
journalctl -u promtail.serviceVerify Promtail configuration:
promtail -config.file=promtail-config.yml -dry-run
Remember to replace <Grafana_IP>, <Port>, <Loki_IP>, <query_expression>, <plugin_name>, <Promtail_IP>, and <Promtail_Port> with the appropriate values for your setup.
